Before i proceed to code the algorithm I want to see some results in a graph so i know better what's going on.
The output I have now are
VM's are already preallocated.
jobs in the form of cloudlets are generated and assigned to VM's.
A cloudlet requires an entire VM and it is time shared. A cloudlet also uses full utilization model so the entire CPU is used.
Some performance metrics used in the Iqbal et al paper are throughput
I need to first draw a graph for workload generation I took this sample for the RUBiS workload from the Iqbal et al paper,
So
x-axis : Time (in min)
y-axis : Load level (new sessions)
Here are the graphs for the workload generated for the LCG workload (the one I'm using for this experiment)
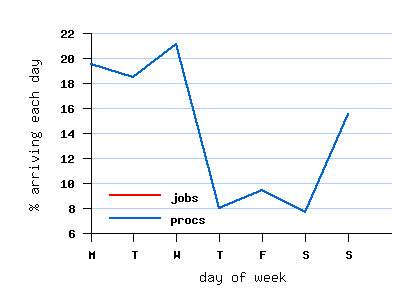
x-axis: day of week
y-axis: % of jobs/processes arriving each day
Other criteria:
job size
job runtime
I'll generate this for 10000 cloudlets:
x-axis: time (starting from 0)(0 to 1000 sec)
y - axis: runtime, I've kept the submission time as 0


I don't think the graph is supposed to look like this.
So now I'm trying to do time vs load
In load I'm taking number of cloudlets that have started and not yet finished execution at a given point in time.
The output I have now are
- cloudlet ID
- the VMID it executes on.
- VMs are statically created on hosts so
- Host #0: VM #4
- Host #1: VM #5
- Host #2: VM #6
- Host #3 : VM #0, VM #7
- Host #4 : VM #1, VM #8
- Host #5 : VM #2, VM #9
- Host #6: VM #3
- Actual execution time,
- Start time on the resource
- End time on the resource.
VM's are already preallocated.
jobs in the form of cloudlets are generated and assigned to VM's.
A cloudlet requires an entire VM and it is time shared. A cloudlet also uses full utilization model so the entire CPU is used.
Some performance metrics used in the Iqbal et al paper are throughput
I need to first draw a graph for workload generation I took this sample for the RUBiS workload from the Iqbal et al paper,
So
x-axis : Time (in min)
y-axis : Load level (new sessions)
Here are the graphs for the workload generated for the LCG workload (the one I'm using for this experiment)
x-axis: day of week
y-axis: % of jobs/processes arriving each day
Other criteria:
job size
job runtime
I'll generate this for 10000 cloudlets:
x-axis: time (starting from 0)(0 to 1000 sec)
y - axis: runtime, I've kept the submission time as 0
I don't think the graph is supposed to look like this.
So now I'm trying to do time vs load
In load I'm taking number of cloudlets that have started and not yet finished execution at a given point in time.
No comments:
Post a Comment